
Open and transparent scoring with measr
An R package for diagnostic classification models
W. Jake Thompson, Ph.D.
2026-09-28
Who am I?
W. Jake Thompson, Ph.D.
- Assistant Director of Psychometrics
- ATLAS | University of Kansas
- Research: Applications of diagnostic psychometric models
- Lead psychometrician and Co-PI for the Dynamic Learnings Maps assessments
- PI for an IES-funded project to develop software for diagnostic models
Diagnostic assessments
Traditional psychometrics
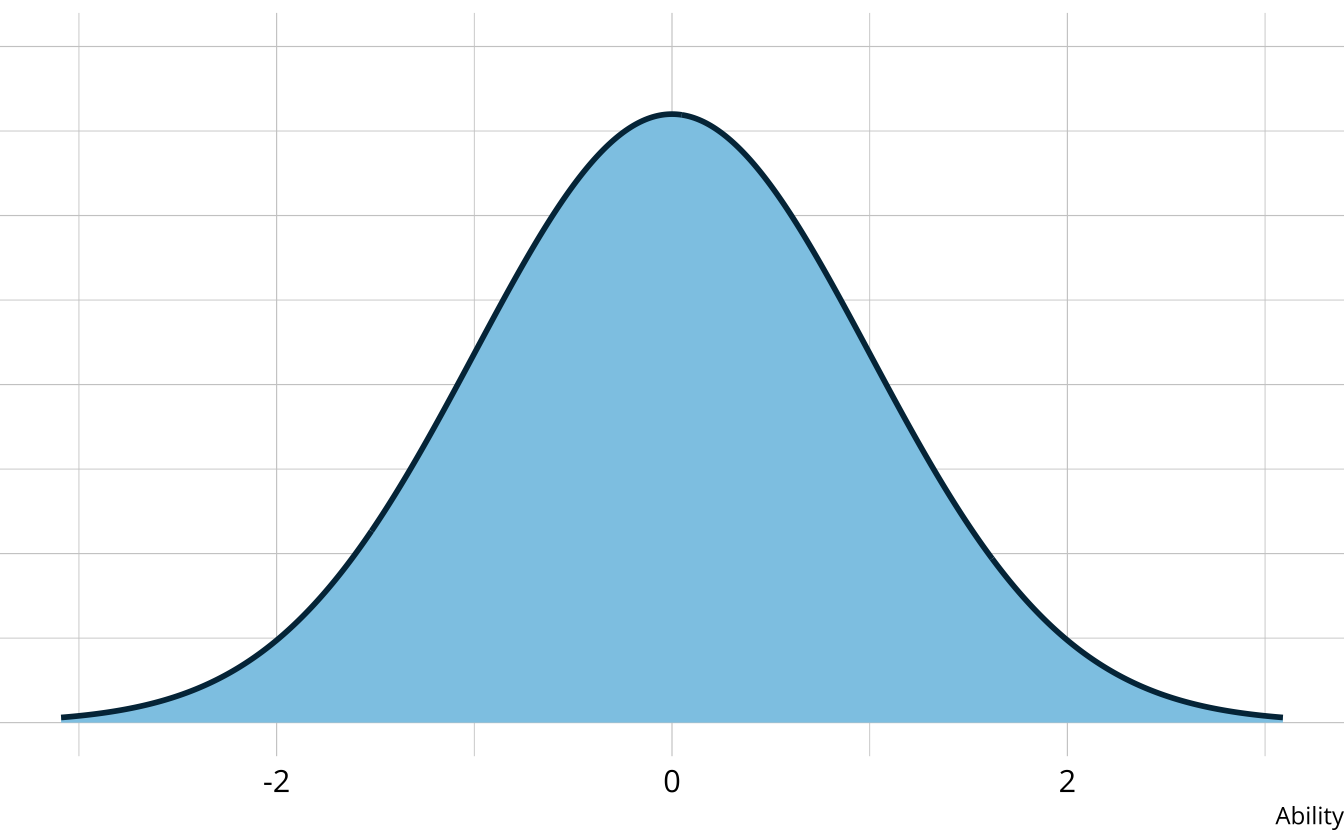
- Traditional assessments and psychometric models measure an overall skill or ability
- Assume a continuous latent trait
Diagnostic measurement
- Designed to be multidimensional
- No continuum of student achievement
- Categorical constructs
- Usually binary (e.g., master/nonmaster, proficient/not proficient)
- Several different names in the literature
- Diagnostic classification models (DCMs)
- Cognitive diagnostic models (CDMs)
- Skills assessment models
- Latent response models
- Restricted latent class models
Diagnostic psychometrics
- Rather than measuring a single trait, we can break the construct into a set of skills or attributes
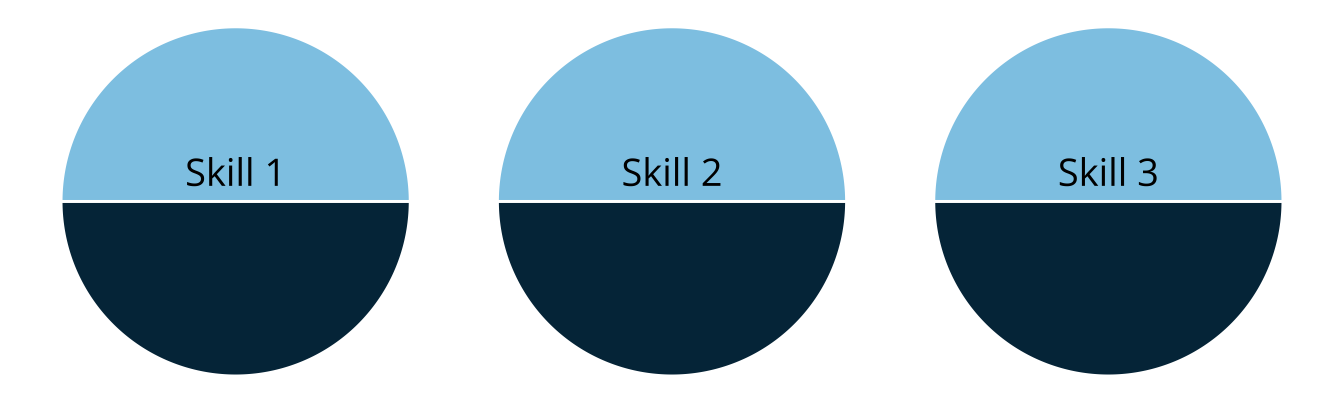
- Attributes are categorical, often dichotomous (e.g., proficient vs. non-proficient)
Benefits of diagnostic assessments
- DCMs place individuals into skill profiles
- Fine-grained feedback to inform instructional decisions (Thompson & Clark, 2024)
- Group students with similar profiles
- Answer more detailed questions about student achievement
- High reliability with fewer items
| Skill 1 | Skill 2 | Skill 3 |
|---|---|---|
Using diagnostic models
Utility of diagnostic results
Attribute-level feedback about student learning is more actionable for instructional decision-making (Thompson & Clark, 2024)
However, the uniqueness and complexity of DCMs can create a “black box” for practitioners and stakeholders
What is measr?
Data for example
- Examination for the certificate of proficiency in English (ECPE; Templin & Hoffman, 2013)
- 28 items measuring 3 total attributes
- 2,922 respondents
- 3 attributes
- Morphosyntactic rules
- Cohesive rules
- Lexical rules
ECPE data
library(dcmdata)

ecpe_data
#> # A tibble: 2,922 × 29
#>    resp_id    E1    E2    E3    E4    E5    E6    E7    E8    E9   E10   E11
#>      <int> <int> <int> <int> <int> <int> <int> <int> <int> <int> <int> <int>
#>  1       1     1     1     1     0     1     1     1     1     1     1     1
#>  2       2     1     1     1     1     1     1     1     1     1     1     1
#>  3       3     1     1     1     1     1     1     0     1     1     1     1
#>  4       4     1     1     1     1     1     1     1     1     1     1     1
#>  5       5     1     1     1     1     1     1     1     1     1     1     1
#>  6       6     1     1     1     1     1     1     1     1     1     1     1
#>  7       7     1     1     1     1     1     1     1     1     1     1     1
#>  8       8     0     1     1     1     1     1     0     1     1     1     0
#>  9       9     1     1     1     1     1     1     1     1     1     1     1
#> 10      10     1     1     1     1     0     0     1     1     1     1     1
#> # ℹ 2,912 more rows
#> # ℹ 17 more variables: E12 <int>, E13 <int>, E14 <int>, E15 <int>, E16 <int>,
#> #   E17 <int>, E18 <int>, E19 <int>, E20 <int>, E21 <int>, E22 <int>,
#> #   E23 <int>, E24 <int>, E25 <int>, E26 <int>, E27 <int>, E28 <int>
ECPE Q-matrix
Model estimation with measr
Transparent reporting with measr
Reporing results with DCMs
Results are typically reported as classifications on each of the assessed attributes
No scale score or ability continuum
Each repspondent receives a profile of mastered skills
| respondent | morphosyntactic | cohesive | lexical |
|---|---|---|---|
| 36 | |||
| 2778 | |||
| 66 | |||
| 865 | |||
| 2509 | |||
| 1591 | |||
| 101 | |||
| 1080 | |||
| 2118 | |||
| 345 | |||
| 200 | |||
| 265 | |||
| 782 | |||
| 10 | |||
| 1017 | |||
| 2174 | |||
| 331 | |||
| 1873 | |||
| 1992 | |||
| 519 |
Probability-based score reporting
measr supports reporting the probability of mastery
Can be used to communicate confidence in classifications (Bradshaw & Levy, 2019)
measr_extract(ecpe_lcdm, "attribute_prob")
#> # A tibble: 2,922 × 4
#>    resp_id morphosyntactic cohesive lexical
#>    <chr>             <dbl>    <dbl>   <dbl>
#>  1 1               0.997      0.967  1.000
#>  2 2               0.995      0.926  1.000
#>  3 3               0.984      0.991  1.000
#>  4 4               0.998      0.993  1.000
#>  5 5               0.989      0.984  0.962
#>  6 6               0.993      0.992  1.000
#>  7 7               0.993      0.992  1.000
#>  8 8               0.00478    0.488  0.967
#>  9 9               0.954      0.988  0.999
#> 10 10              0.659      0.112  0.0911
#> # ℹ 2,912 more rows
Evaluating classifications
- Rather than individual attribute classifications, we can evaluate across the population of respondents (Johnson & Sinharay, 2018)
- Accuracy: Probability the estimated classification is “correct”
- Consistency: Probability that two parallel forms result in the same classification (i.e., test-retest)
Evaluating probabilities
- We can also evaluate the mastery probabilities across respondents (Johnson & Sinharay, 2020)
- Informational: The proportion of uncertainty in an examinees mastery status that is eliminated by observing their item responses
Evaluating scoring pipelines
Scoring algorithms are often a “black box”
-
measr is completely open source
- Available on GitHub: https://github.com/r-dcm/measr
- Examine exactly how measr estimates models and calculates evaluation metrics (e.g., model fit, reliability)
Users can also host their analysis scripts using measr, allowing other experts or the public to evaluate how the software was used
What’s next?
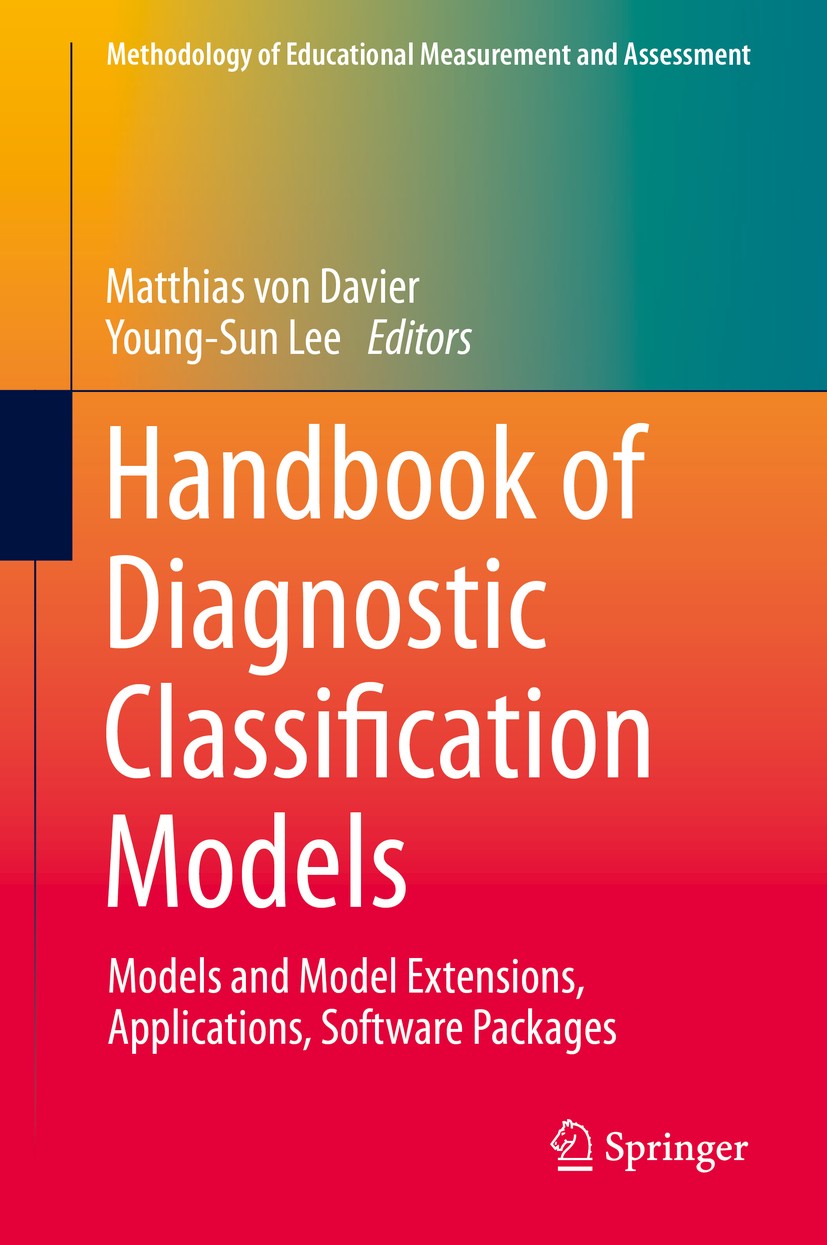
Learn more about DCMs
Learn more about measr
Learn more about our work
Two more sessions highlighting how we have used DCMs drive assessment forward and improve student outcomes
-
Through-Year Assessment as a Summative Tool: Proof of Concept Evidence from the Pathways for Instructionally Embedded Assessment (PIE) Project
- Today, September 28
- 16:00–16:30, Trinity Ballroom - Salon 3
-
Using Diagnostic Classification Models to Improve Instructional Decision-Making
- Thursday, October 1
- 15:20–15:50, Trinity Ballroom - Salon 3
r-dcm.org
Acknowledgements
The research reported here was supported by the Institute of Education Sciences, U.S. Department of Education, through Grants R305D210045 and R305D240032 to the University of Kansas Center for Research, Inc., ATLAS. The opinions expressed are those of the authors and do not represent the views of the Institute or the U.S. Department of Education.